Part 3
By David Boleneus
Our State Colliding with Climate Insanity?
4.0 COSTS, IMPACTS FROM WIND TURBINES
What are impacts of wind turbines? What can be done? A sample of more than 100 studies referenced at wiseenergy.org....Wind Energy: Local Economics 101 compared the materials wind industry salespeople frequently cited of $2M benefit compared to actual impacts and found that the average impact is a loss of -$6.5 million on any wind project due to loss of property values (-$0.6M), agricultural losses due to bats (-$2.6M), agricultural losses due to local weather changes (-$0.1M), loss of tourism (-$4.4M), due to adverse health impacts (-$0.2M), due to hydrological, including drinking water and well impacts ($0.1M), ecological impacts to wildlife systems (-$0.2M), and varied impacts to livestock, hunting, communication, military and turbine leaseholders (-$0.3M). See impacts[i].The basic steps to winning an onshore local wind war are here[ii].
4.1 Electricity Cost Rises as Renewables Expand. Professor Simmons lists the full cost of wind[iii]. These include transmission losses, cost of maintaining back up power (from coal or natural gas) during no or low wind conditions, high cost of maintenance and subsidies. Although just 4% of electricity in the US (just 1% worldwide) comes from wind turbines, the wind industry relies on $30 billion in US tax subsidies available from 82 federal agencies or grants. Many of the subsidy pots go to foreign businesses. The subsidy set at 2.5 cents/kwh (3.5 cents/kwh post-tax) a troubling fact has emerged. The wind turbine industry will in time cause the shutdown of all other reliable forms of power not receiving the same gifts as each becomes uncompetitive. Investor Warren Buffet seems to be perfectly fine with receiving tax breaks for making investments in Big Wind. "I will do anything that is basically covered by the law to reduce Berkshire's tax rate," "For example, on wind energy, we get a tax credit if we build a lot of wind farms. That's the only reason to build them. They don't make sense without the tax credit.”[iv]
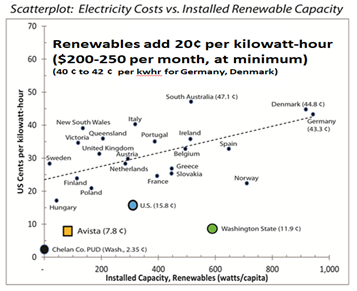
As competitors disappear the rise in cost of electricity can be directly traced to the percentage unbridled growth in costs of renewables that electrify a region (see Ontario). The chart assembled by the author shows that for each one kilowatt of renewable energy installed per capita that the electricity charged by the utility rises by up to 20 cents per kilowatt-hour. Accordingly a 20¢ rise adds $200 to $250 per month to electric bills, at minimum, with other locations experiencing much larger rate increases. Highest prices are seen in Australia and Europe with very high charges are in Denmark (44.8¢/kwh), Germany (43.3¢/kwh) South Australia (49.1c.kwh) and Italy (40.3¢/kwh). A breakdown of details of billing in Germany shows the generation cost and surcharge fees. In the last decade Germany's electric generation charges have fallen 1.5 cents per kwhr while surcharge additions of 36 cents have accumulated since Energiewende began.
4.2 Renewables are a One-Way Street. The democrat-controlled legislature has decided. The change to renewables while trashing traditional electric sources of natural gas and coal (perhaps nuclear) is not reversible. There is no backwarding. Has the public approved the change? Should they? Is the change purely a democrat idea? Should there be a state referendum to decide? Has anyone shown that renewable will work/not work as planned? What will be the cost, the impacts? Should there be a benefit versus cost study done? No studies address these questions.
4.3 Renewable Cost 84X Washington's GDP; Land Area Immense. The cost of a renewable power systems for Washington can now be estimated from combination of Mark Jacobsen's (Stanford Univ.)[v] renewable projections including land area requirement for California and the World Bank[vi] sourcing of materials costs for several renewable systems. Table (1) is the cost for California's renewable system using these sources. The $188,801 billion is the materials cost without labor and operating costs with battery systems accounting for 99% of the cost. Wind systems $53 trillion, solar PV $1,233 trillion!

Table (2) are costs for Washington and U.S. The adjustment to determine cost is based on number of households in each state. Washington has just 22% of California's households. The cost for Washington's renewable is $41.5 trillion (green highlighting), an amount 84 times larger than the state's gross domestic product.
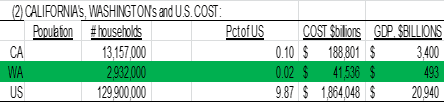
California's cost is 56 times larger than the state's GDP and a US-wide system is 89 times larger than the US GDP of $20.94 trillion.
Who or what will Washington's $41,536 billion capital cost (excludes operating cost)...the state, utilities, customers? Who has that money? Likely the State, UTC and utilities will collude to make customers to pay it. How much? Divided by 2,932,000 households is $14.1 million per household.
Now to land area. Jacobsen estimates land for California renewables is 26,658 sq. miles. Using the 22% of households to adjust from California, shows Washington land area required is 5,945 square miles. How much is this, and where?
Because of the vast are required It is best to devote parts of counties, with the 10 counties selected renewable systems should be where a majority voted for Biden as these folks must agree with Green New Deal-BuildBackBetter ideas. Red counties are smarter. On this basis the area needed is 35.3% percent of each Biden counties of Clallam, Clark, Jefferson, King, Pierce, Skagit, Snohomish, Thurston, Whatcom, and Whitman counties.
4.4 Ontario's Monumental Failure. Ontario's free-wheeling liberal Parliament and Premier Dalton McGinty passed its GreenEnergy Act 2009[vii][viii][ix][x][xi][xii] resulting in closing of coal power plants province-wide, once the most efficient system in North America while the majority rapidly signed several $7 billion deals with wind generators at a rate 400% over the cost of competitive coal electricity and solar providers at 1000% above competitive coal accumulating total expenditures of $170 billion over 30 year terms which funded a number of social program as well[xiii][xiv][xv][xvi][xvii][xviii]. Rick Smith, PhD biology, Environment Defence Canada hailed GreenEnergy a cost free operation to catapult the province into the renewable big leagues. Peter Victor, York University's green guru and Bruce Laurie Green Energy Act Alliance provided the 2005 Cost-Benefit Analysis saying there would not be a burden on customers with the numbers renewable is doable as modeling shows no more than a penny's increase in the average electric bill, so Ontarian's will not notice the change[xix] By 2011 when electric rates rose from 5.5 cents in 2005 to 22 cents in 2010 when the Auditor General reporting the alleged economic and social benefits were not yet realized. Ontario's Society of Professional Engineers had issued half a dozen reports critical of liberal's green talk and politics overriding sound policy with society head Paul Acchione, an OSPE engineer calling the program green corporate welfare. Professor Bryne Purchase of Queens University said the "coal exit" was physically impossible to do but for a long time one could not repeat these words. By 2014 with obligations to pay $133 billion coming due the liberals added super-surcharge fees[xx] to utility bills which often added several hundred dollars to bills to address the backlog of fees equivalent to consumers funding the backroom policy fiddles, sweetheart cash transfers and subsidies to shut programs unpopular to the environmental agenda. By now carbon dioxide was costing the liberals $257 per ton rather than the $17 per ton at the Quebec-California cap and trade system which soon resulted in startup of Ontario's Climate Exchange. By 2015 electric prices (adding global adjustments) grew to 29.9 cents/kwh with utility bills growing 5 times faster than the consumer price index[xxi]. At this time reports surfaced about talk of the province defaulting on both the debt and the generator's contracts[xxii][xxiii]. By 2016 prices rocketed to 36 cents/kwh growing six times faster than CPI. Liberals reacted in 2016 by borrowing another $18.4 billion labeled Fair Trade Hydro Plan to rebate 7 cents to pay down customer bills to 27 cents, at a cost of $30 billion over ten years gambling that interest rates will not rise above 1%.[xxiv] [xxv][xxvi] [xxvii][xxviii] In the end Ontario's green electricity became a monumental failure resulting in Conservative Doug Ford winning election over liberal Premier Kathleen Wynne in 2018 with promise to end Ontario's adventure with its carbon tax.
Ontario's Green Energy Act is the largest transfer of wealth in Canadian history.
It takes money from the people, including the poor and middle class, and gives it to large corporations. http://www.windontario.ca/[xxix][xxx][xxxi].
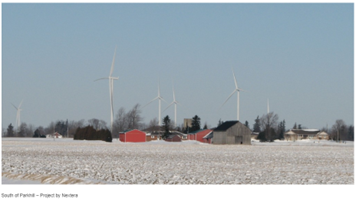
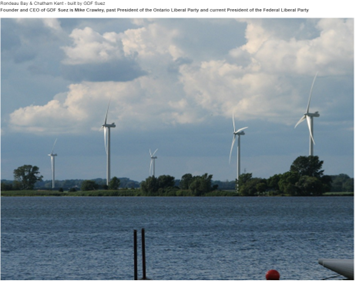
Two locations illustrate the concentration of wind turbine in proximity to homes in Parkhill Ontario and Chatham-Kent along the Lake Erie shoreline, Ontario. Locations are 35 miles to 63 miles east or northeast of Detroit Michigan.
If you or a health officer knew that noise from wind turbines was a known or suspected health hazard, would you allow people to live near them?
An unexpected result writes Terry Corcoran and EnergyPerspective in several unreferenced reports is that the cost of electricity generated by wind was 44¢/kwh resulting from a combination of obligated payments with the unanticipated mis-match of wind generation with demand. In the winter, spring and fall with demand low but with generation substantially above damand, higher generator cost plus fixed obligations (with incentive to generate at maximum possible) found the additional power was unsalable anywhere in Canada or the US with wasted electricity unknown $millions per day. The summer was a reverse with generation at low wind output with higher demand[xxxii][xxxiii][xxxiv].
4.5 Energy Poverty. Who Pays? Increasing costs to consumers compels life choices that most have never faced. Following Ontario's Green Energy Act most affected lower income groups.[xxxv][xxxvi][xxxvii][xxxviii][xxxix][xl] From 2010 to 2013 in Ontario 34% of the $27,000-$47,700 income group experienced cost increases of 17% in living expense and 28% in transportation cost to move them below the poverty line. Low income assistance increased 20% by 2014, disconnects from power grew by 19% to 62,370 customers before Christmas with 7% considered low income. An additional 421,040 utility customers not yet disconnected could not pay their utility bills, so in arrears with arrears debt growing 40% to $148,000,000. Utilities installed load limiters in Smart meters to 9,824 customers effectively prevent ng use of microwave and conventional ovens and larger appliances and tools. These actions forced increased use of generators and weighing the cost of paying electric and buying food.[xli]
People have to choose between heating and eating in Ontario and electric prices rise out of sight[xlii].
Newswatch[xliii] (Bancroft, Ont.) reports electricity prices jumped 16% in just one year (Aug 2015-Aug 2016) with residents reaching the breaking point. Ian Seaborn was disconnected but obtained a generator from neighbors says even with generator heating now, budget billing and ditching TVs and computers I couldn't keep up and right now we are considering moving in with parents. Resident Jessup and wife says we have to decide between heating the house and feeding the kids. Utility bills jumped to $600 a month with HydroOne installing a load limiter made matters even worse so we could not cook. I'd rather feed my kids but I am behind on my HydroOne bill. Bill Kilpatrick, Bancroft Councilor says the electricity situation has hit hard forcing choices among necessities and half the utility bills are delivery costs (global adjust surcharges) with costs doubling in the winter time which is more than my mortgage payment. Social worker Marcia Depotier was forced to sell her house when level billing increased to $798 and another 60,000 customers had to be disconnected she heard.

Brian Hill Associate Producer Global News reports[xliv] rising energy costs and poverty collide in rural Ontario. Mel Kemp and Peter brunette were cut off by HydroOne with Kemp part time employed drives school bus and the Peter is a mechanic in Kingston. The current utility bill was $1418 and HydroOne told them the next would be $1,000 but it was $3,142 so HydroOne disconnected power including the lines. With the sump pump out water rose in the basement 3 feet and mold began reaching 6 feet making a terrible stench. Insurance would not cover the damage because they were without electricity. Taking a shower is something we can't do anymore and it's difficult to get a good meal. The run the generator to charge the batteries and the 2 or 3 inverters and candles and are without telephone and internet. Francesca Dobbin United Way told Global News that no power is driving people into hospitals and mental health facilities, that electricity ought to be considered a human right.

Associate Producer Brian Hill Global News reports[xlv] high hydro costs are ruining lives of Ontario families. A utility leaves family of 6 without electricity for six months. The utility bill of the family that lives an hour east of Toronto, often reached more than $900 a month including $400 delivery cost charge (global adjustment surcharge). Once the arrears charge reached $10,000 the utility disconnected electric service. Carol said their usage has been unchanged for the 20 years living there but charges have increased 20-fold. Her husband would bring home water every day to boil for the children to use shower bags but they drink bottled water. Try explaining to your children why mommy is out in a blizzard trying to cool dinner on the BBQ. Carol said I wait until the kids are asleep, then I cry. I try to be positive but I can't.
4.6 Where's the Electricity? Experts Promise Blackouts Coming. A major local utility expresses concern for the electricity supply they must provide by the Washington CETA law, which cannot happen. It projects "electricity blackouts" will be common-place in our winter months for any usual 10 day stretch in December, January or February when 50% of customers will go without electricity. The reason: With traditional energy systems shut, renewables cannot provide it to fill the gap. The renewables proposed and hydroelectric dams combined fail to provide more than one-half of needed supply of electricity. Expert power planners illustrate below the 80% greenhouse gas-reduction case (without natural gas) invites widespread winter cold blackouts because electricity cannot be provided, but at the 100% GHG-free case CETA mandates when conditions worsens dramatically, demand explodes higher, supply dwindles to pose life-threatening conditions. This will begin after 2030 when the CETA law comes into full effect.
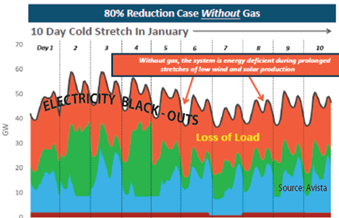
Utilities are compelled to satisfy Washington's CETA mandates, without regard to blackouts, or impact on customers. Utilities plan to add 34,400 megawatts (MW) of wind and solar in Washington, an amount equal to output of 6.1 Grand Coulee Dams and 32,000 MW wind and solar in Oregon. Despite this energy capacity, utilities cannot deliver more than 5% of these addition sources during widespread still, cold and overcast that continued for 20 days in January 2022.
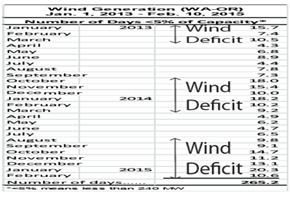
4.7 Bonneville Proves Wind Cannot Perform. Wind is a NO-SHOW in time of need. The power generation record of wind turbines available from the Bonneville Power Administration for its 46 WA-OR a system proves that wind, no matter the number of turbines cannot provide electricity when the wind does not turn the blades. The table shows the number of days per month over a period of 776 days when a low or no-wind condition (defined as a deficit) exists, when BPA's wind turbine output falls below 5% of capacity. Over the 776-day October 2013 to March 2014 period the deficit extends for 81 days or 45% of the winter. The subsequent Oct. 2014 to Feb. 2015 deficit period lasts 88.8 days. Of great concern: 3.8 million BPA customers are promised electricity yet 3.6 million did not receive electricity. The period without generation lasts 10.2 days to 20.3 days for any month.
Minnesota ruled that wind turbines cannot be trusted to provide reliable electricity because wind is unpredictable and uncontrollable. The state's Court and Public Utilities saying a natural gas power plant would better serve public interests[xlvi]. And just at Earth Day the film Planet of Humans show green energy sources excoriate, even destroy the environment while making billions for developers to show wind power isn't free.[xlvii]
4.8 Fish, Duel of Dams versus Wind Turbines. In the battle to "crown" the electricity generation star posing the four Snake River dams (capacity, 3,489 MWs) against the BPA's 37-percent larger wind capacity at 46 wind farms (capacity, 4,782 MWs), the 46 wind farms together underperformed output of the 4 dams for 26 to 30 days per month (92%) over each of the January through May months for the five years 2014 through 2018 by producing 64% less electricity than the 4 dams on the Snake River.
4.9 No Birds, No Bats, Then What? The economic importance of bats to agriculture is very important so death from any source raises concerns[xlviii]. The value of bats to agriculture in Washington's most effected counties is estimated at $235 to 548 million annually with greatest threats in 14 Washington counties of Whitman, Lincoln, Adams, Spokane, Walla Walla, Benton and more (table). Threats to bats comes from two sources, the fungus disease white-nose syndrome and the loss of bats killed by wind turbines with threats from wind turbines of more chronic and long term.[xlix]. The economic value of bats to the agriculture industry is in the range of $22.9 billion to $53 billion a year which includes the cost of pesticide applications. If wind turbines continue expansion as currently the economic losses to agriculture may increase several-fold. In some places winter colony declines due to WNS are 70% with little brown bat sending them near extinct and tree dwelling bats are being killed in unprecedented numbers estimated at 3-5 million per year[l].. The death rate due to wind turbines is up to 110,000 per year in the mid-Atlantic highlands alone. "In California wind and solar are now killing 48% of the priority bird species.[li] Effects of renewables extended far beyond the location of energy production to impact bird populations in distant across continental migration networks with nocturnal migration species most vulnerable to solar and grassland species most vulnerable to wind turbines" while expansion of wind turbines continues unabated in California and expected to grow 50% in 8 years from 59,000 turbines in 2021. As renewables expand losses of species will accelerate. Since bats are insectivorous and voracious eaters of insects, then any risk to populations also effects the agricultural economies.
For example, a small group of 150 big brown bats consumes 1.3 million pest insects a year so contributes to disrupting the population cycle of pests. A colony of a million little brown bats is capable of consuming 660 to 1320 metric tonnes of insects per year, so the danger of eliminating bats by both WNS and wind turbines is very real. Since there is not validated method to reduce the risk of WNS to bats, so the Impacts of wind energy appear to pose a more chronic and long term threat to long terms losses of bats.
The legalized slaughter of eagles and other large birds of prey was legitimized under the Obama administration and continues today is a blatant disregard for the Migratory Bird Treaty Act. At the time, it was estimated that nearly 600,000 birds of all types were killed by the much smaller turbines, including 83,000 hunting birds such as hawks, falcons and eagles. Fish and Wildlife Service has established "take limits" at wind turbines, to establish a legal number of birds of prey that can be legally killed. In February 2022, the take limit was expanded to 15,832 birds, which by comparison is 25% of the 2009 population allowed to be legally slaughtered[lii].

The most egregious recent violation was in Converse County Wyoming which killed 44 golden eagles. FWS regularly imposes fines on oil companies and electric transmission firms for inadvertent deaths of bald eagles, all the while approving green-induced eagle carnage of a grand scale from turbines. In the same area in the 1970s, a rancher Herman Werner was convicted, fined and jailed for killing eagles that killed his sheep.
4.11 Real Estate Values Plummet Near Turbines. I have compiled 31 sites to review the impacts of wind turbines on real estate values. Just ask. Wind turbines neighbors take thousands off your real estate and home values[liii]. Study by LSE found value of homes close to wind farms slashed by 11%; Home that costs £250,000 would lose £27,000 in value; and Homes as far at two-and-a-half miles away could be reduced by 3%. A 2019 German study of 3 million homes near wind turbines found devaluations are extensive, and particularly large within a mile of a property. A small town in New York could have a $41.5 million property value loss (about -15% value decline) due to a single proposed wind project in offshore Lake Ontario[liv]. In the second largest study ever done by the London School of Economics show that homes near wind turbines will decline in value with the Searchlight wind project estimated to depress property values by 25 to 60 percent. Appraisal reports in Ontario estimate the average diminution of real estate values in several areas as follows: Clear Creek 18 turbines (-35.7%), Melancthon 133 turbines (-38.8%) .[lv][lvi]
4.12 Raw Materials Needs for Renewable Systems; Comparing Performances[lvii] In 2017 the World Bank estimated the raw material needs (minerals, metals, non-metals, manufactured products) to build renewable energy systems. The following lists the material needs which equates to the capital cost to build each. The capability expressed material cost adjusted for efficiency ($US per megawatt (MW)) using the current prices[lviii] of raw materials. The cost in materials to construct a conventional coal plant, for comparison is $1,717 per MW. It is clear from World Bank data that all renewable systems are at least 10 times more expensive to build than conventional coal. In the case of the top three most costly systems, grid storage, solar PV and wind turbines, their cost ranges from 286 times (wind) to 4,656 times (solar PV) to 849,000 times (grid storage using lithium batteries) more costly than conventional coal plants. One must not forget that national media advertises wind and solar as "free" energy, but in reality it is much different. Most likely grid storage, solar PV, wind turbines and capture of carbon dioxide will never be built on large scale due to their unaffordable high cost in comparison to conventional electrical power systems.

4.13 Raw Materials Dictate Go/NoGo Wind, Solar Expansion. Another method to evaluate system's limits is to consider the quantity of materials available to build the system. In 2019 I evaluated the material need to build a wind system to serve all Washington State electricity need to citizens in 2.9 million homes solely by this method. At least 100,000 wind turbines are needed to provide the current electric load used, although a reserve is not included in the estimate. Major material needs sourced from US Geological Survey include rare earth metals neodymium and dysprosium, molybdenum, iron ore, copper, clinker, construction sand and gravel, cement and coal. Expressed in terms of 2018 produced quantity in the US, needs could be provided by all except iron ore, molybdenum and rare earth element (REE) metals (REEs). The need for copper would consume 78% of one year's quantity produced domestically but greater need for iron ore, molybdenum and rare earth metals range from 113%, 1,331% and 14,293% larger than the 2018 quantity produced in the US. Raw material costs excluding construction total $2.9 trillion. So it is possible to build a wind system for one state, with exception of iron ore, molybdenum and REEs. The sources of the last two come from countries that are not always friendly to the US, China and Peru or Chile. The US is 100% dependent on other countries for REEs and 35% for copper and China controls 90% of world REEs supply. In the case of copper the US reserve of copper would be exhausted on building such a system after 12 states and the reserve of molybdenum exhausted with the 2nd state. So, in terms of total known supply (includes identified but unmined) needed to build wind system from the necessary supplies, the copper supplies known in the US are only sufficient to build wind in 12 states while the molybdenum supply only sufficient in the US to build wind in 2 states, before exhausting. Other sources are available but are protected from developing in Wilderness Areas or in National Parks. It's a choice easy for some.
4.14 Copper: Its Impact on Nationwide Wind Expansion. Let's go one step more to estimate the copper metal needed to build wind turbines sufficient to supply electricity needed from wind for all U.S. states. Each wind turbine megawatt requires 2 tonnes of copper. To provide 1,591 gigawatts requires 120,780,000 tonnes copper metal. Where do you obtain 120.7 million tonnes copper? You don't-not anywhere in the world of minable or known copper. For comparison, the lifetime production of copper from the Berkeley Pit in Butte Montana, labeled the Richest Hill on Earth, was 18 million tonnes would require 6.7 Berkeley's. To get copper from the Pebble Mine now proposed in Alaska, but unwanted by all environmental groups everywhere could produce 544,000 tonnes per year, and employ 2,000 jobs over its life of 45 years would require 222 Pebble mine lifetimes. To get 120.7 million tonnes from the Bingham mine near Salt Lake City, Utah that today produces 300,000 tonnes Cu annually whose copper resource is just a few years from exhausting would require 355 Bingham lifetimes. How about the largest mine on earth? The largest copper mine Escondida is in Chile and produces 990,000 tonnes annually would require 107 Escondida lifetimes to supply copper to build a wind turbine system across the U.S.
May 7, 2022